
Happy Median
The graph below shows 6 monthly office space absorption in the 6 capital cities since 1990 from the PCA figures. They are the most consistent figures in the market.
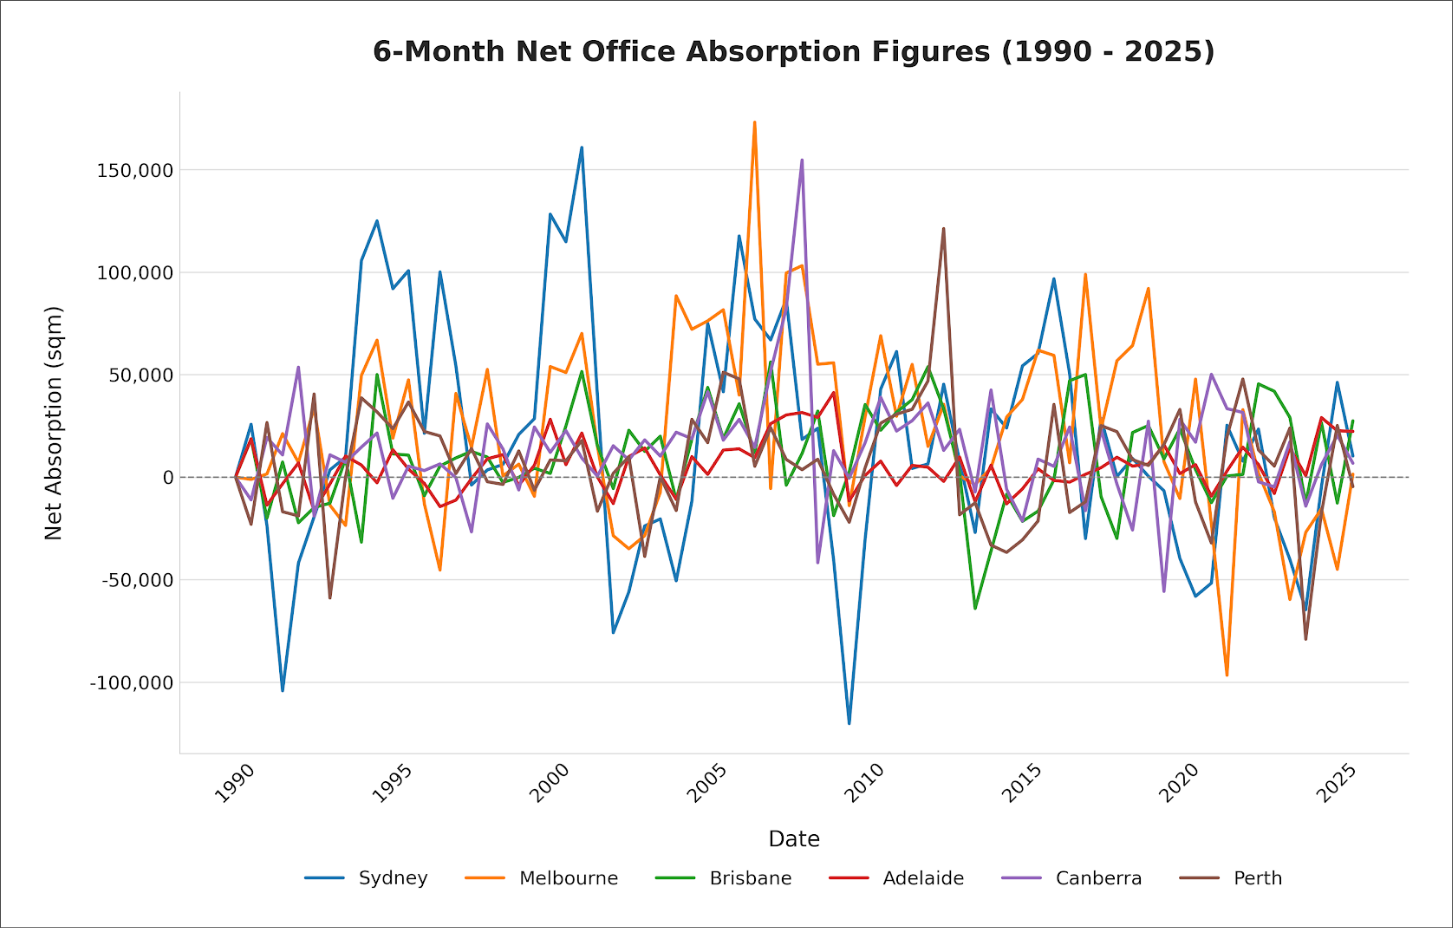
Last week’s CREview numbers showed how absorption has changed over the last 5 years. But what does the future look like? The volatility of absorption makes it difficult to predict but by using median and average figures, one can at least get a little indication of what it may be.
The PCA’s median and average 6 monthly net absorption figures in the 6 capital cities over the last 35 years in square metres is shown below.
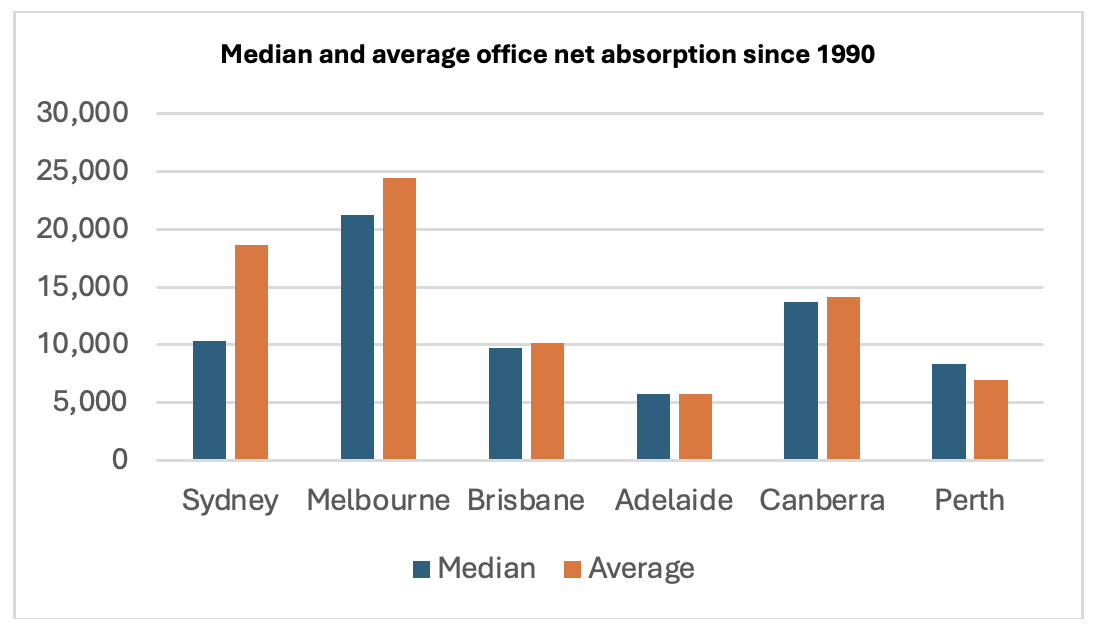
Who would have thought Sydney’s and Melbourne’s long term average 6 monthly absorption would only be this? And from my statistics days at uni, when the median is less than the average it implies the numbers are skewed to the positive or interpreted another way – absorption is falling like the numbers have shown in our previous CREview.
Brisbane, Adelaide, and Canberra look balanced and hence median and average figures provide a good indicator for the future.
Perth is the only market to have the median higher than the average but we see that as a reflection of the boom-bust nature of Australia’s resource capital more than any correlation between the median and the average.
Where to from here for absorption? Everyone has their own view. It will continue to be volatile, which is normal, but if incentives firm in various markets so will absorption because in the end, history shows that absorption follows incentives.
No Comments